

Improve Your Data Visualisations with These Easy-to-Use Matplotlib Style Libraries
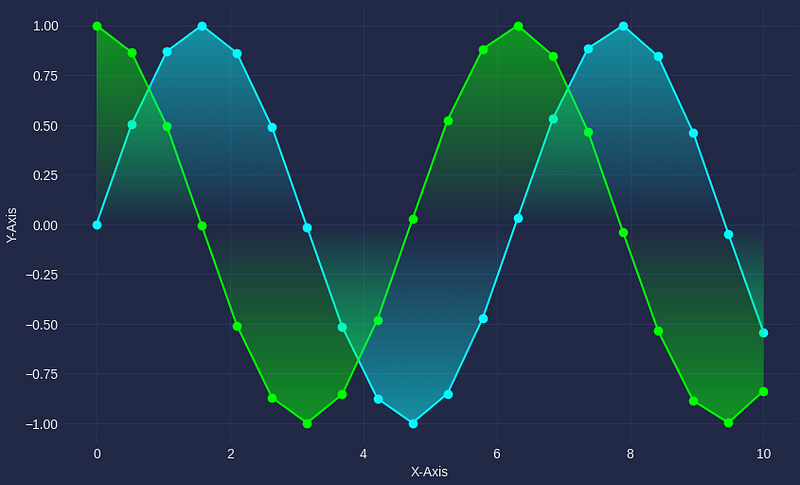
Matplotlib is a widely used data visualisation Python library, and is often come across early in the data science and python learning journey. However, over the years, it has gained a reputation for creating plain-looking figures, and it can be awkward to use, especially for newcomers.
In my last few articles, I have shown how we can turn the basic plots that matplotlib creates into something that is more eye-catching and aesthetically pleasing to look at. This has ranged from extending the plotting code by writing several additional lines of code to just adding a few lines.
In this article, I will share with you four matplolib theme libraries that can easily take your matplotlib figures from boring to interesting. Each theme can be applied using two lines of code — an import statement and a use statement …