

A simple tutorial on how to enhance your Seaborn violin plots with ease
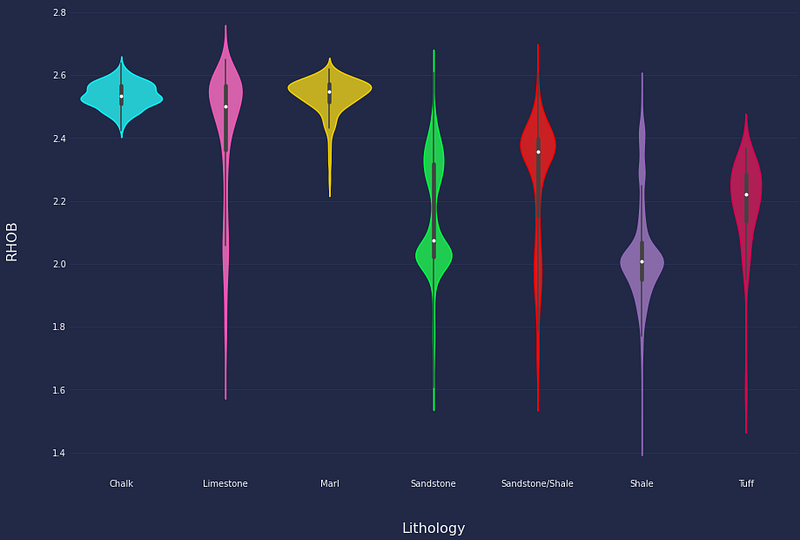
Violin plots are a common data visualisation that combines the power of a boxplot and a density plot into a single plot. This allows us to visualise more information within a single figure. For example, we can view the basic statistics from the boxplot, identify possible outliers, and view the distribution of that data. This can help us understand if the data is skewed or contains multi-modal distributions.
Within my latest series of articles, I have been exploring ways to improve and enhance basic matplotlib figures using various themes, including a cyberpunk style. This style provides a futuristic neon-like appearance to the plots and only requires a couple of lines of code to apply to matplotlib and seaborn figures.
If you want to learn more, you can see how I applied it to matplotli…