
Adding Formation Data to a Well Log Plot
Taking well log plots one step further using Python and matplotlib

Taking well log plots one step further using Python and matplotlib
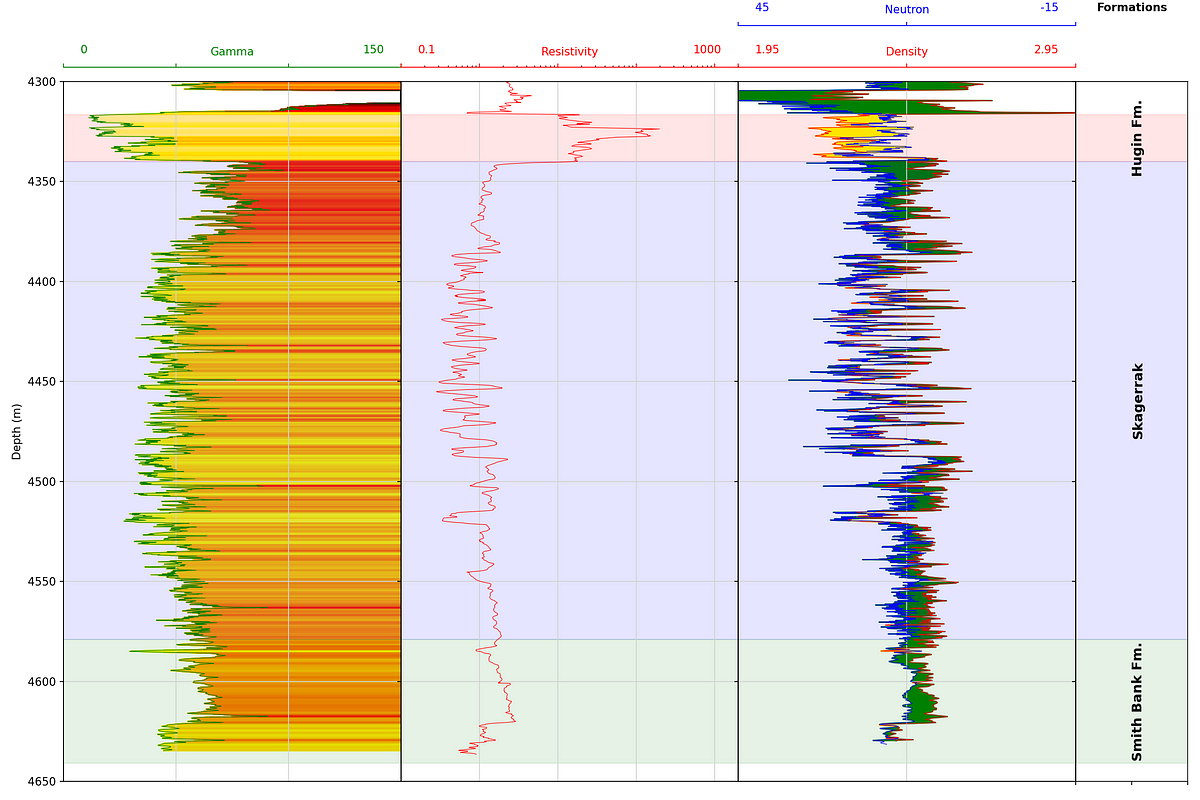
Well log plots are a common visualization tool within geoscience and petrophysics. They allow easy visualization of data (for example, Gamma Ray, Neutron Porosity, Bulk Density, etc) that has been acquired along the length (depth) of a wellbore.
I have previously covered different aspects of making these plots in the following articles:
In this article, I will show how to combine these different methods into a single plot function that allows you to easily reuse the code with similar data.
For the examples below you can find my Jupyter Notebook and dataset on my…
Keep reading with a 7-day free trial
Subscribe to Subsurface Syntax to keep reading this post and get 7 days of free access to the full post archives.